Machine Learning
Airbnb NYC Popularity - Explainable ML
Using Random Forest and SHAP analysis to predict and explain Airbnb listing popularity
This machine learning project predicts how many reviews an Airbnb listing might receive per month using the 2019 NYC Airbnb dataset (48,895 listings, 16 features). Through iterative model development - from baseline DummyRegressor to an optimized Random Forest - and SHAP-based explainability analysis, the project transforms predictions into actionable strategies for hosts. The final model achieved R2 = 0.59, explaining 59% of the variance in listing popularity.
With nearly 49,000 Airbnb listings in New York City, hosts face intense competition. Understanding what drives listing popularity - and being able to predict it - could help hosts optimize their profiles and help Airbnb improve its recommendation engine. But popularity depends on a complex mix of location, pricing, availability, and guest feedback, making simple heuristics insufficient.
48,895
Airbnb listings in the dataset
16
Features analyzed
R2=0.59
Final model accuracy
EDA
Exploratory Data Analysis
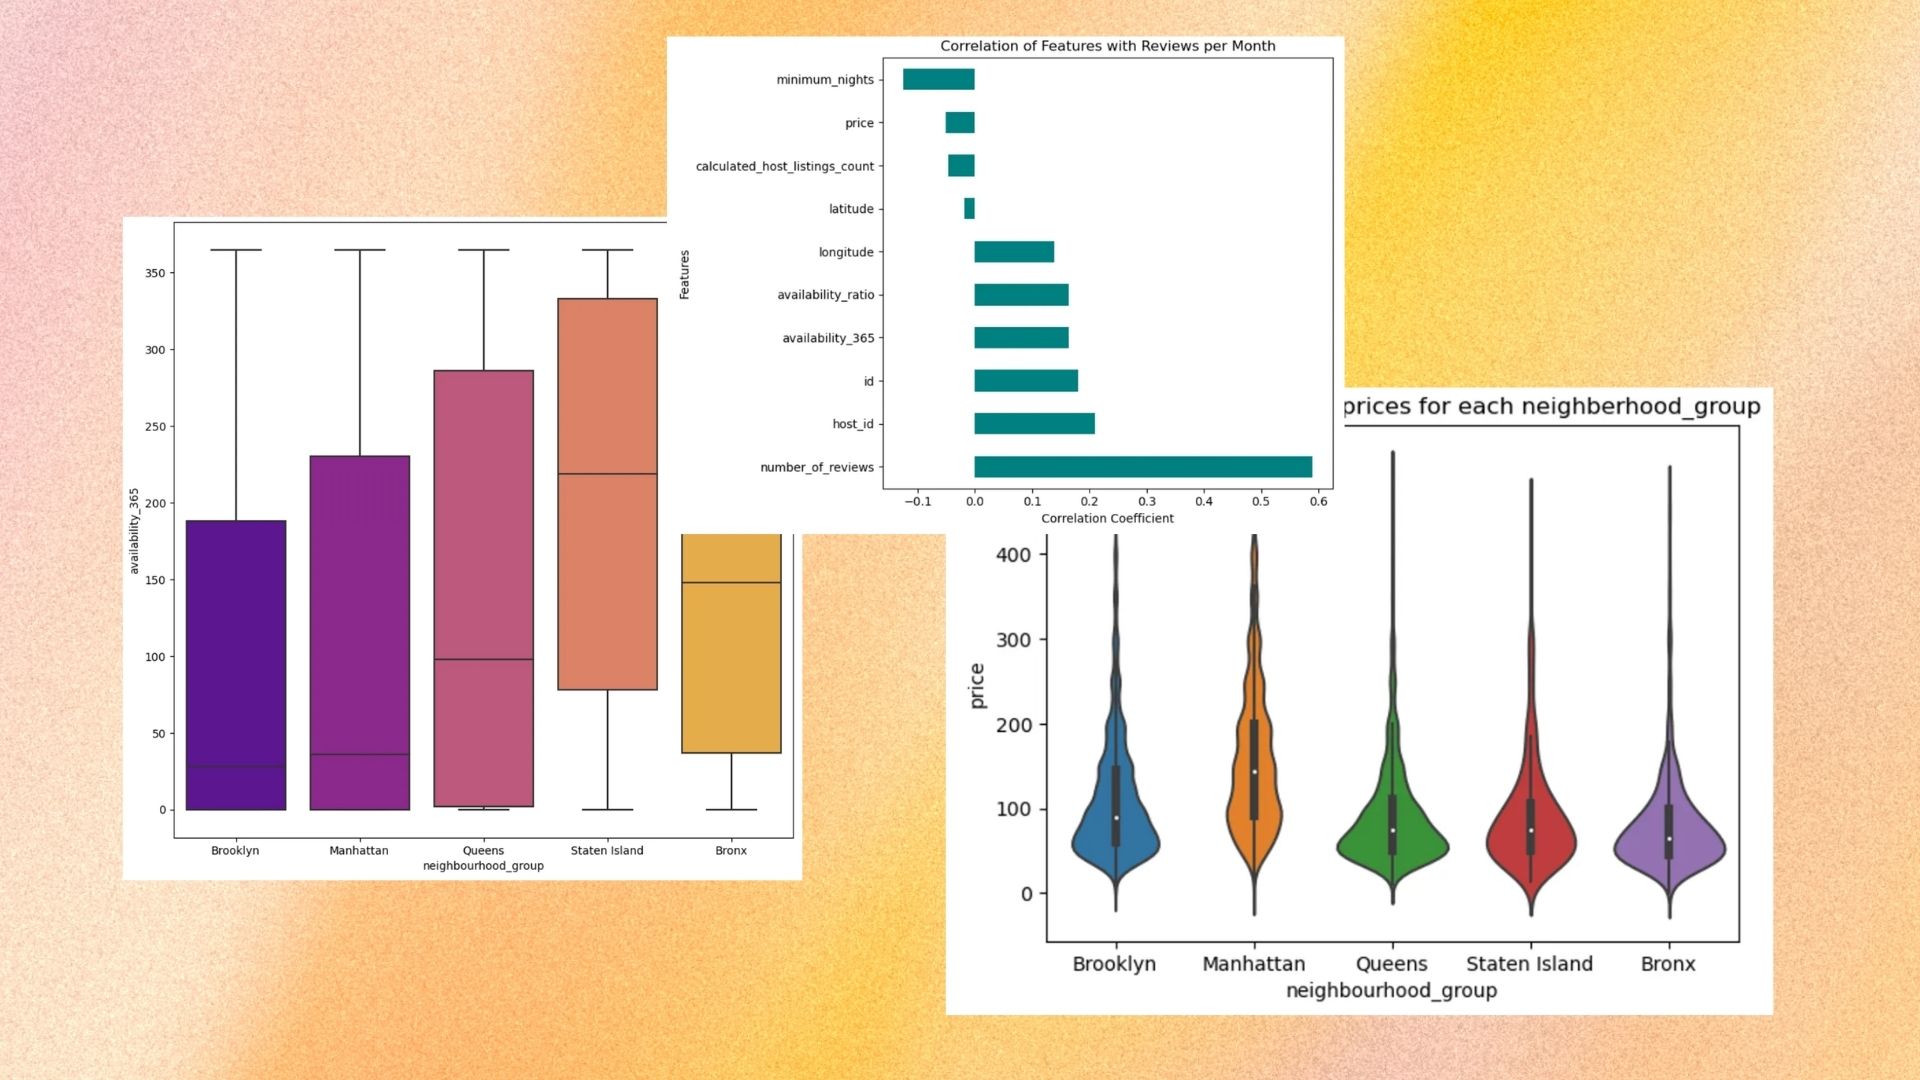
Analyzed price distributions across boroughs (Manhattan median ~$150, Bronx ~$65), availability patterns, room type preferences, and correlations between features and review counts.
Baseline
Establishing a Baseline
Started with a DummyRegressor (mean strategy) as baseline: MAE 1.15, R2 -3.33 (worse than guessing). This set the floor for meaningful model improvement.
Linear Models
Ridge Regression
Applied Ridge Regression with GridSearchCV over alpha values. Achieved MAE 0.81, R2 0.38 - a significant improvement but with room to grow.
Model Comparison
Comparing Advanced Models
Tested KNN Regressor (CV MSE: 1.49), SVR (CV MSE: 1.44), and Random Forest (CV MSE: 1.20). Random Forest clearly outperformed the alternatives.
Optimization
Bayesian Hyperparameter Tuning
Used BayesSearchCV on Random Forest (n_estimators: 115, max_depth: 14, max_features: sqrt). Best CV MSE: 1.13.
Explainability
SHAP Feature Importance
Applied SHAP TreeExplainer to understand which features drive predictions. Number of reviews, minimum nights, and availability were the top drivers - not price or location.
0.578
Mean Absolute Error (MAE)
0.986
Mean Squared Error (MSE)
0.993
Root MSE (RMSE)
0.593
R-squared (R2)
Random Forest (optimized)
Best model
BayesSearchCV
Optimization method
Number of existing reviews is the most impactful feature - encouraging guest reviews creates a compounding popularity effect
Shorter minimum night requirements drive more bookings - flexibility attracts more guests
Year-round availability strongly correlates with more reviews - maximizing your calendar pays off
Location and price had surprisingly lower impact than expected - it's more about listing behavior than geography
Explainable AI (SHAP) transforms a black-box model into actionable business recommendations
Iterative model development
Progressing from baseline to Ridge to Random Forest with Bayesian optimization showed how each step provides meaningful improvement - and when to stop iterating.
Explainability > accuracy alone
A model that explains 59% of variance but reveals actionable insights (via SHAP) is more valuable than a marginally better black-box model.
Feature engineering matters
The dataset lacked temporal and seasonal features, limiting accuracy. Understanding what data you don't have is as important as modeling what you do.
Writing for a technical audience
Publishing the analysis on Medium taught me to balance technical depth with readability - making data science accessible without oversimplifying.