Climate Data Science
Serene Skies: Aviation CO₂
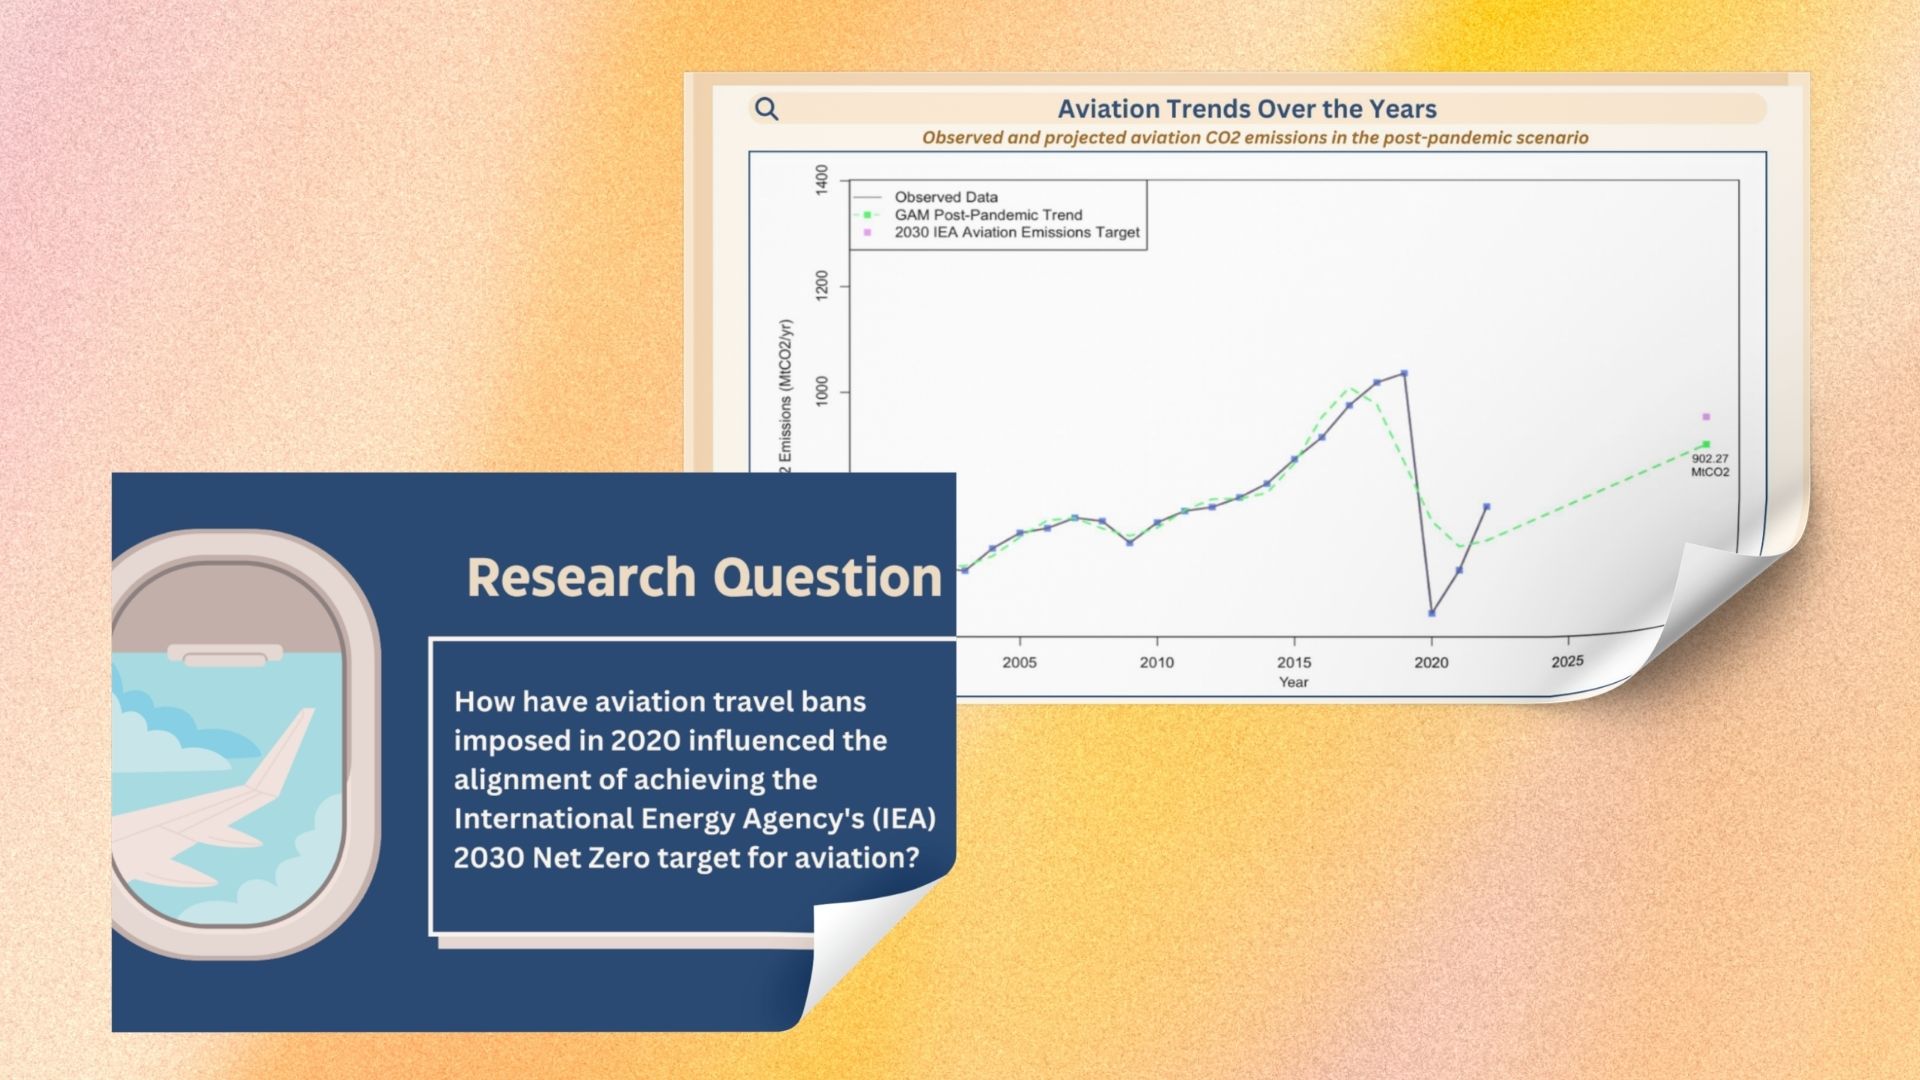
Forecasting aviation emissions using GAM modeling and pandemic data
Serene Skies investigates whether the COVID-19 pandemic's disruption to global aviation created a lasting shift in CO2 emission trajectories. Using Generalized Additive Models (GAM) on IEA historical data from 2000-2022, the study forecasts 2030 aviation emissions at 927 MtCO2 - below the IEA's Net Zero Emissions target of 954 MtCO2. A pre-pandemic model using only 2000-2019 data predicted 1,347 MtCO2, well above the target.
Aviation accounts for roughly 2.5% of global CO2 emissions and is one of the hardest sectors to decarbonize. When COVID-19 grounded flights worldwide, global air traffic dropped 43.7%, leading to a 14.3% decline in aviation CO2 emissions. This unprecedented disruption raised a critical question: did the pandemic permanently alter the emission trajectory, or will emissions rebound to pre-pandemic projections?
43.7%
Drop in global air traffic during COVID-19
927
MtCO2 forecasted for 2030 (post-pandemic model)
4.05%
Model error rate (MAPE)
Data Collection
Data Collection
Compiled IEA historical aviation CO2 data (2000-2022) in MtCO2 per year. Validated using IEA's Tier 1 approach with IPCC emission factors.
Model Selection
Model Selection
Chose Generalized Additive Models (GAM) for their ability to capture non-linear relationships in time-series data without imposing rigid parametric assumptions.
Dual Modeling
Dual Modeling
Built two GAM models: post-pandemic (2000-2022 data including the disruption) and pre-pandemic (2000-2019 data only) to compare trajectories.
Forecasting
Forecasting
Extended both models to forecast 2030 emissions. Compared predictions against the IEA's Net Zero Emissions (NZE) scenario target of 954.22 MtCO2.
Validation
Validation
Assessed model accuracy using Mean Absolute Error (MAE) and Mean Absolute Percentage Error (MAPE). Both models achieved MAPE below the 10% threshold.
927 MtCO2
Post-pandemic forecast (2030)
1,347 MtCO2
Pre-pandemic forecast (2030)
954 MtCO2
IEA NZE target (2030)
4.05%
Post-pandemic MAPE
0.88%
Pre-pandemic MAPE
420 MtCO2
Difference between models
The post-pandemic model forecasts 2030 emissions below the IEA Net Zero target - suggesting the pandemic created a lasting downward shift
Without the pandemic disruption, the pre-pandemic model predicts emissions 41% above the NZE target by 2030
The 420 MtCO2 gap between models represents the pandemic's structural impact on aviation emission trajectories
Model limitation: using only 'year' as the independent variable overlooks GDP, regulation changes, and travel demand patterns
Pandemic as inflection point
COVID-19 didn't just temporarily reduce emissions - it may have permanently altered the growth trajectory of aviation CO2. Behavioral shifts (remote work, virtual conferences) and airline fleet modernization appear to have lasting effects.
Paris Agreement within reach
The post-pandemic trajectory suggests aviation's contribution to climate targets is achievable, but only if current trends in efficiency and behavioral change are sustained through policy support.
GAM for policy analysis
Generalized Additive Models proved effective for capturing the non-linear impact of major disruptions on emission trends, offering a flexible forecasting tool for climate policy analysis.
Beyond the model
Future work should incorporate GDP, fuel prices, regulatory changes, and sustainable aviation fuel adoption as additional predictors to improve forecast accuracy.